In the dynamic world of B2B SaaS marketing, webinars stand out as powerful tools for engaging prospects and driving conversions. However, proving revenue impact can be a challenging feat. This is where integrating your Sequel account with HubSpot comes into play, offering a solution to the puzzle of measuring webinar success effectively.
Imagine having the ability to visualize crucial data points, measure webinar effectiveness, and fine-tune your marketing strategies—all in one centralized dashboard. By tracking your Sequel.io activity in Hubspot this becomes a reality, empowering you to glean actionable insights that can supercharge your marketing efforts.
So, how exactly can you harness the power of HubSpot's reporting features to create a custom dashboard tailored to your webinar objectives? Let's dive into the step-by-step process to answer questions like:
Before we can really understand the impact your webinar programs are having you need to ensure you have your data on lock. To do this we'll need to add two things before we can dive into the reports, a property and a workflow. You can add properties in your settings under Data Management. You can learn more about properties from Hubspot here.
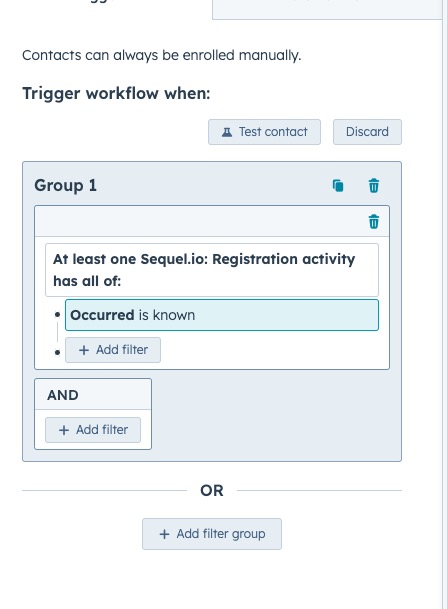
For this, we'll use a Company property and we'll name it Webinar Attribution (company). For Field type, we'll need a Single Checkbox. Next, we'll create a Contact-based workflow. We want this to trigger whenever someone registers for your webinar so we'll use the Sequel.io Registration activity "Occurred". Setting this to "known" will capture every person who registers for an event.
For our action, we'll choose Set Property Value from the CRM section, change the Target Object to Company, and find the Webinar Attribution (company) property we created earlier. For the new value select Yes and save the workflow.
Now we know which companies in our Hubspot have been impacted by our webinar strategy and the magic can begin!
Each of these reports will require Data Sources, Configurations, and Filters. The Data Sources for all these reports will be Deals (Primary) and Company. We've compiled the Configurations and filters for each of these for you here. Once you've built the reports and seen the results we encourage you to tweak these dials to tell your webinar story more effectively.
Let's start by creating a report that shows the total deal amounts for deals influenced by your webinar strategy in the current pipeline. This will give you a clear picture of the revenue generated from webinar-influenced deals.
Next we'll track the number of new deals created week over week that were influenced by your webinar strategy. This metric provides insight into the growth and momentum of your webinar-generated leads.
Measure the total pipeline generated from webinar leads in the current quarter. This metric helps you understand the overall impact of your webinar strategy on pipeline growth.
Compare the pipeline generated from webinar leads quarter over quarter to identify trends and patterns in your webinar performance over time.
Analyze the win/lost rate specifically for deals influenced by webinars. This metric reveals the effectiveness of your webinar strategy in driving successful conversions.
Similarly, compare the win/lost rate for deals that were not influenced by webinars. This comparison helps you evaluate the relative impact of webinars on deal outcomes.
Finally, examine how webinars impact deal velocity by analyzing the time it takes for webinar-influenced deals to move through the sales pipeline compared to non-webinar deals. This metric highlights the efficiency and effectiveness of your webinar strategy in accelerating the sales cycle.
Now that you have a clear understanding of the key metrics to track, let’s dive into how to set up your custom dashboard in HubSpot:
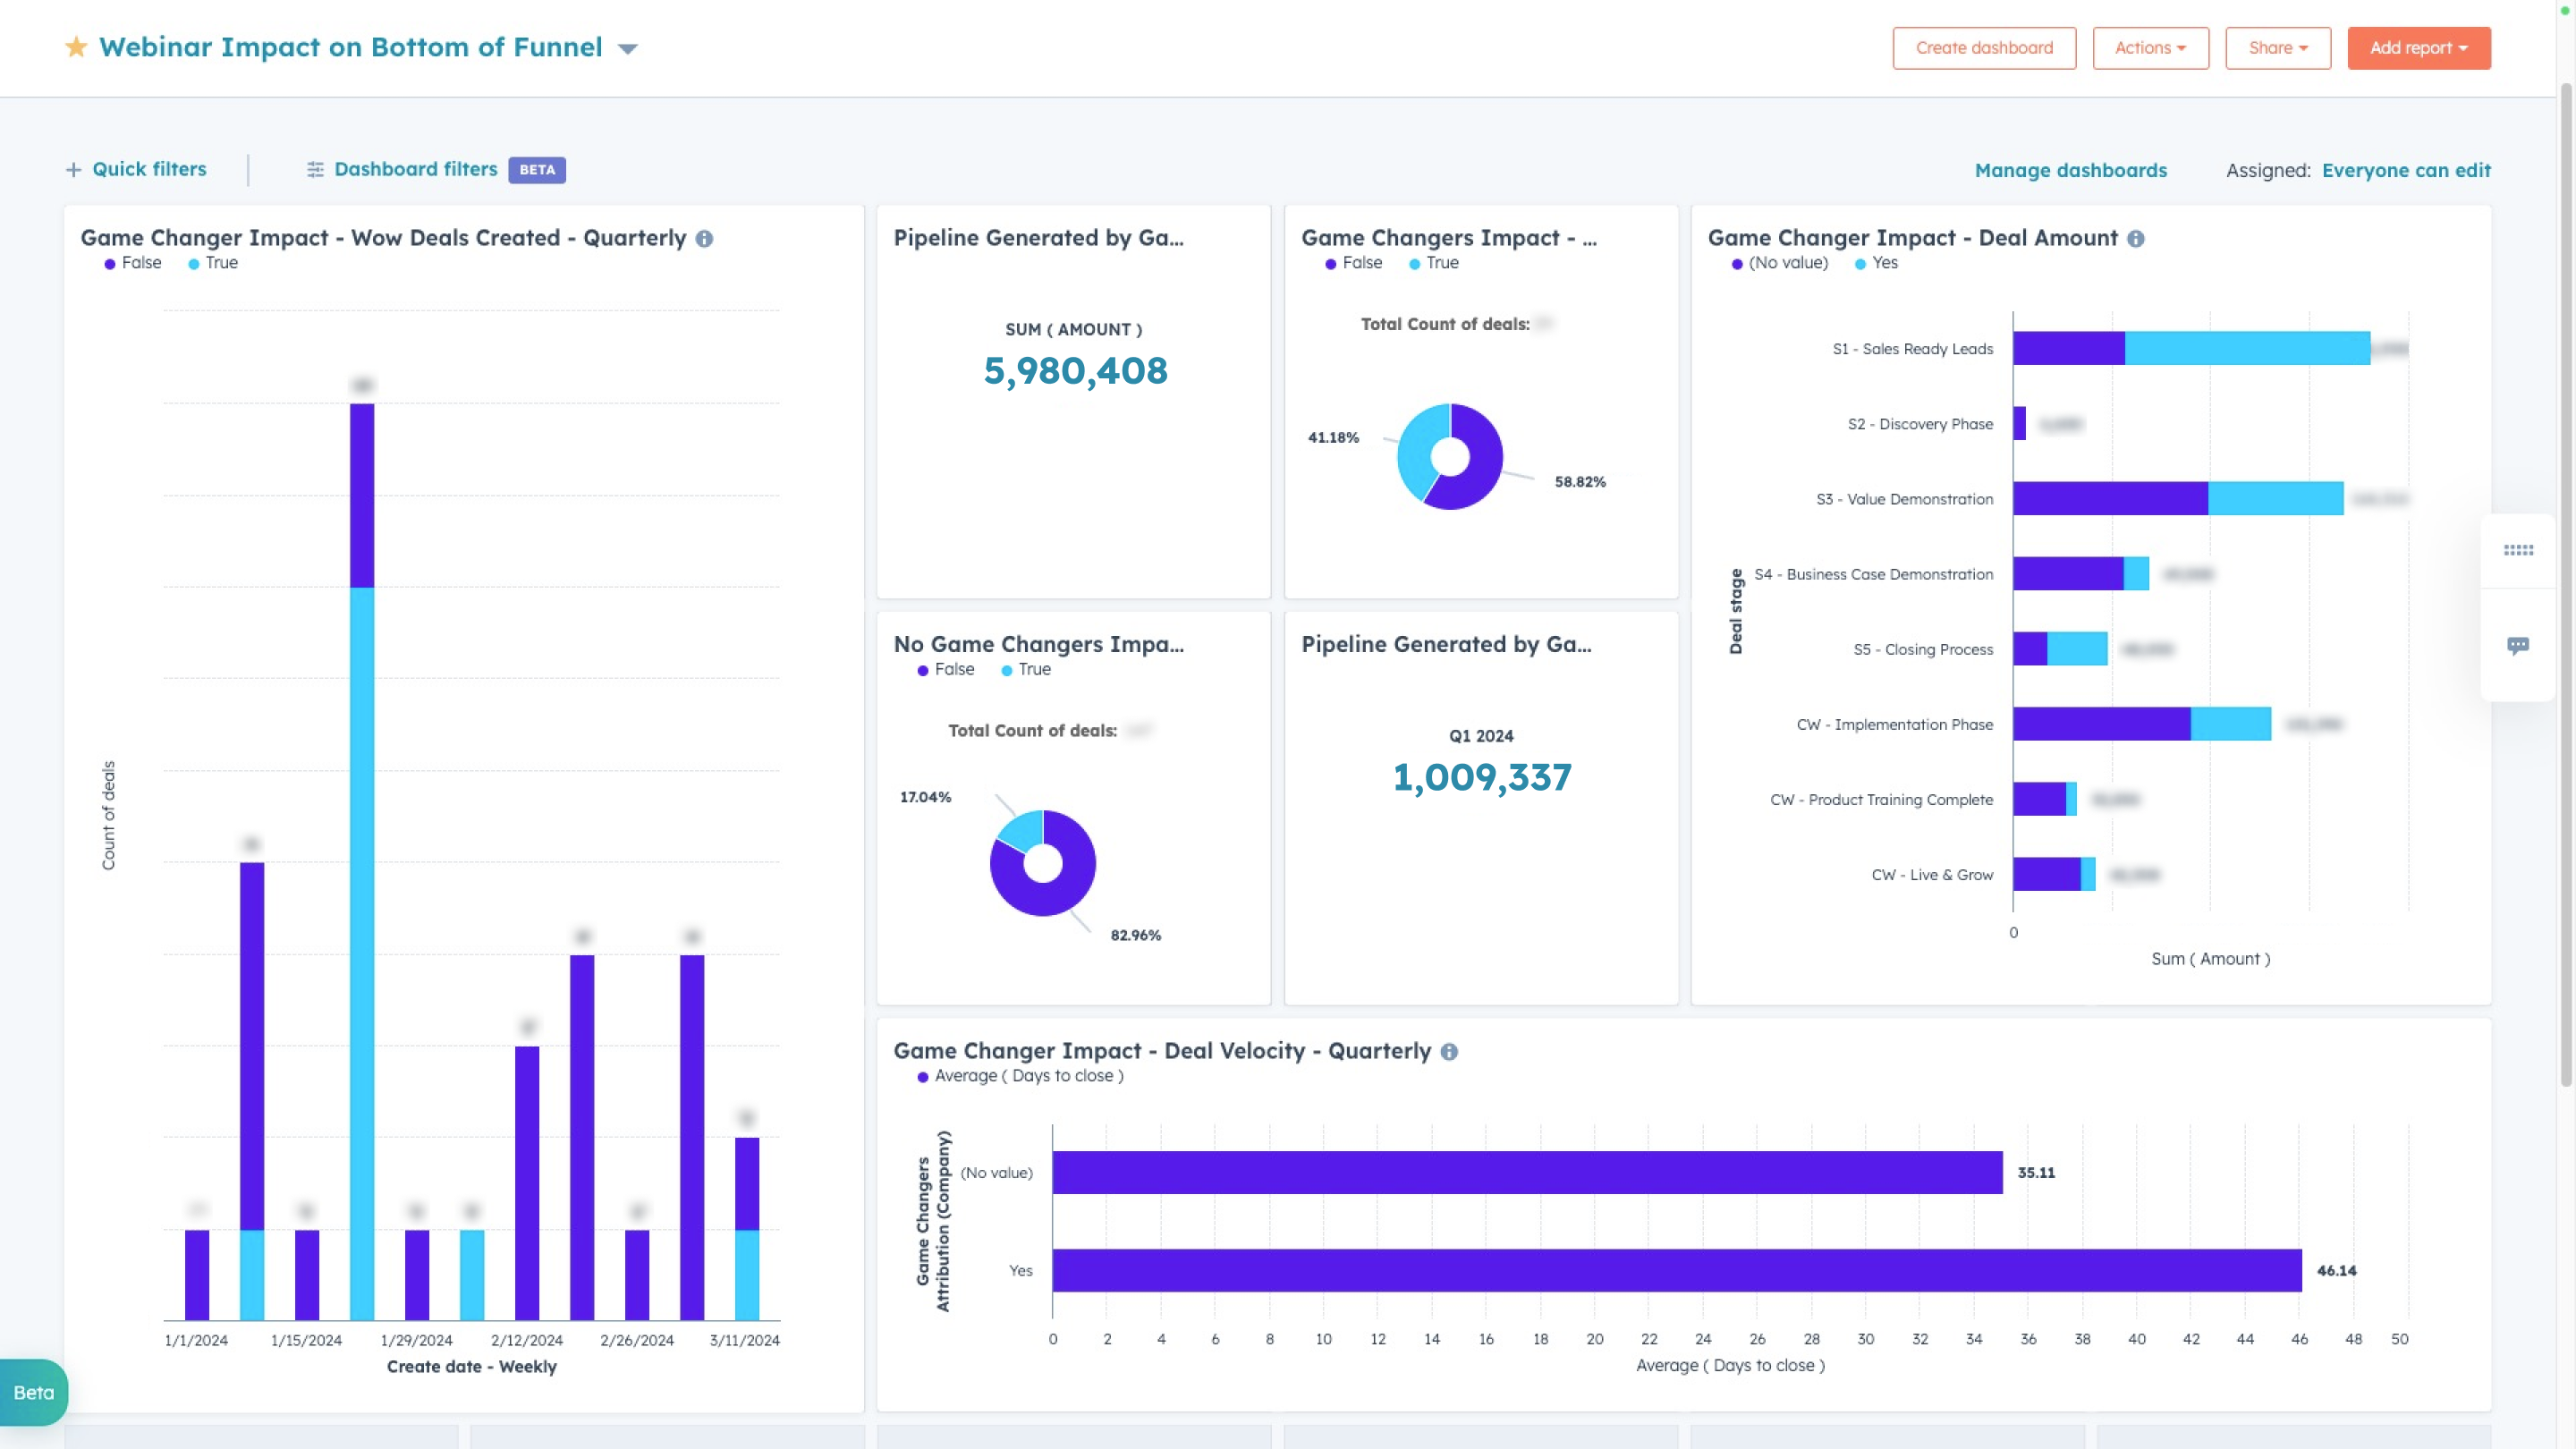
When you're finished you should have something that looks like this.
By following these steps and regularly monitoring your dashboard, you can gain valuable insights into the business impact of your webinar strategy and make data-driven decisions to optimize your marketing efforts. With Sequel.io's native HubSpot integration, you get access to powerful reporting capabilities, have the tools you need to maximize the ROI of your webinar initiatives and drive success for your B2B SaaS business.
Remember, the key to success lies in not only hosting engaging webinars but also in effectively measuring and analyzing their impact on your bottom line. With a comprehensive dashboard in HubSpot, you can do just that and take your webinar strategy to new heights.


